
Introduction
The Bank Nifty index has surged to fresh all-time highs, breaking past key resistance levels and entering a zone where market psychology becomes far more important than pure valuation. When an index trades in “uncharted territory,” traders face one of the hardest questions of technical analysis: Is this a genuine breakout with room to run, or a bull trap waiting to snap?
This article provides a complete examination of the Bank Nifty’s technical structure, fundamental health, liquidity flows, and macro drivers, concluding with a clear outlook for the coming trading week.
What’s Driving Bank Nifty to Record Highs?
Banking stocks are traditionally considered the backbone of India’s equity market. When Bank Nifty hits new highs, it often signals broad economic optimism. Several tailwinds are pushing the financial sector upward.
1. Robust Credit Growth
Indian banks are witnessing double-digit loan growth, fueled by retail lending, MSME borrowing, home loans, and corporate credit revival.
2. Healthy Balance Sheets
After nearly a decade of NPAs, bad loans, and balance-sheet restructuring, Indian banks now stand on strong footing with:
- lower NPAs
- better provisioning
- robust liquidity coverage
- enhanced capital adequacy
3. Rising Profitability
Banks are posting improved net interest margins (NIMs). Even with interest-rate uncertainties, spreads have remained favourable for lenders.
4. Strong Domestic Liquidity
Domestic institutional investors (DIIs) continue heavy inflows, counterbalancing occasional FPI outflows. This cushion keeps the index supported during volatility.
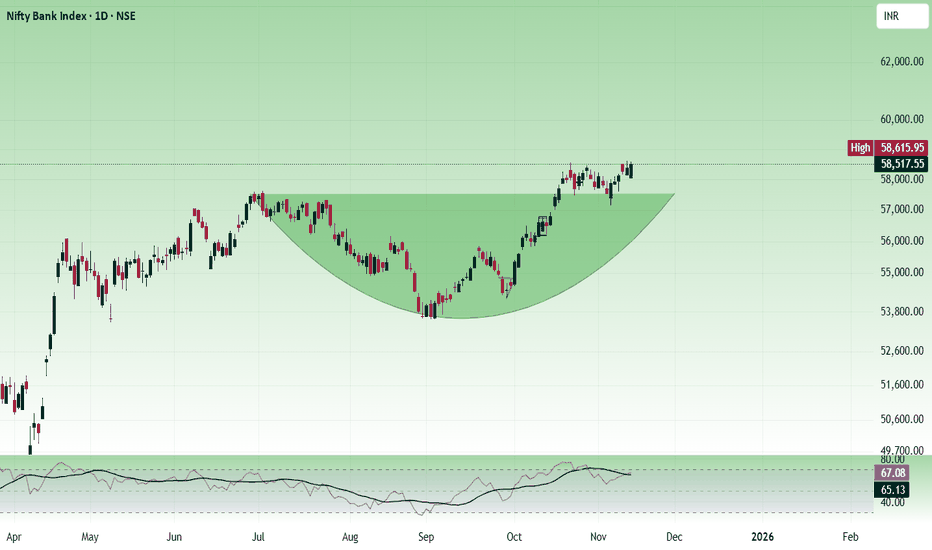
Technical Picture: The Most Important Levels
The technical chart of the Bank Nifty shows a clear breakout from a multi-week consolidation zone. Here’s what matters:
1. Breakout Confirmation
- Strong candle close above previous resistance
- Higher-than-average volume
- No immediate rejection from sellers
This combination suggests a valid breakout rather than a false one.
2. Key Resistance Ahead
Even after a breakout, minor psychological resistances exist around:
- 59,500
- 60,000
- 60,500
Round-number levels often trigger profit-booking.
3. Support Zones
For next week, immediate support is visible at:
- 58,000 – 58,200 zone
- 57,400 – 57,600 zone (major swing support)
If Bank Nifty stays above the first zone, bulls retain control.
4. Indicators
- RSI slightly overbought — suggests caution, not reversal
- MACD firmly bullish
- Moving Averages: all key MAs sloping upward
Derivatives Positioning: Big Clue for Next Week
Options data shows:
- Heavy call OI buildup near 60,000 — suggesting a ceiling
- Strong put bases at 58,500 and 58,000 — indicating powerful support
This creates a defined trading range next week:
➡️ 58,000 – 60,000
Macro Drivers to Watch Next Week
Several macro triggers could cause movement:
1. US Dollar Index & US Bond Yields
A rising dollar might pressure global equities, including India.
2. RBI Statements
Any commentary on rates, liquidity, or inflation can shift sentiment.
3. Bank Earnings (If Any Scheduled)
Any mid-quarter updates from top banks can impact the index.
4. FPI Flows
Large inflows → boosts Bank Nifty
Outflows → can trigger quick selling
Next-Week Outlook
Tone: Moderately bullish
Structure: Steady with possible minor pullbacks
Bias: Buy on dips unless 58,000 breaks
Range: 58,000 – 60,000
Breakout Trigger: Sustained close above 60,000
Breakdown Trigger: Fall below 57,500
Conclusion
Bank Nifty is in a structurally strong uptrend supported by fundamentals, liquidity, and technical patterns. Unless major global risk events occur, the index remains poised for a slow grind upward with intermittent consolidation.