

Reliance Power Share Price Analysis – July 2025
Market Update as of July 21, 2025 | Comprehensive Stock Analysis
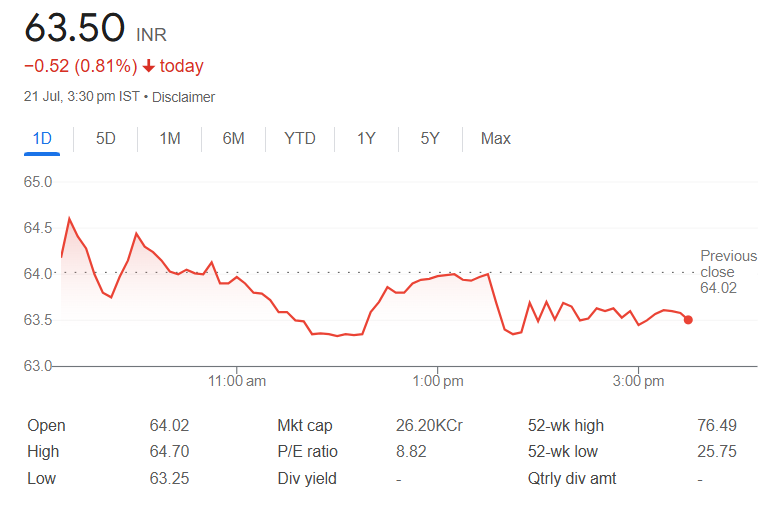
Current Price (NSE)
₹63.39
52-Week High
₹76.49
52-Week Low
₹25.75
Market Cap
₹26,270 Cr
Current Market Snapshot
| Exchange | Open | High | Low | Close | Volume |
|---|---|---|---|---|---|
| NSE | ₹64.02 | ₹64.70 | ₹63.25 | ₹63.39 | 4,434,236 |
| BSE | ₹63.61 | ₹64.89 | ₹63.00 | ₹64.00 | 1,483,503 |
The stock has shown 0.25% decline compared to previous close of ₹65.11, with moderate trading volumes.
Financial Performance Highlights
Q1 FY26 Results (April-June 2025)
- Net Profit: ₹44.68 crore (positive turnaround from losses)
- Net Sales: ₹1,885.58 crore (down 5.35% YoY)
- EBITDA: ₹704.77 crore (down 3.14% YoY)
- EPS: ₹0.11
- Debt Servicing: ₹584 crore paid in Q1
Share Performance & Returns
| Time Period | Return | Performance |
|---|---|---|
| 1 Week | -2.71% | Volatile |
| 1 Month | -0.05% | Stable |
| 3 Months | +51.96% | Strong Growth |
| 1 Year | +129.38% | Exceptional |
| 5 Years | +1,678% | Massive Rally |
Key Developments & News
- Profit Turnaround: First profitable quarter after years of losses
- Major Project Win: 350MW solar + 175MW/700MWh battery storage project awarded
- Operational Efficiency: 97% PLF at Rosa plant, 91% at Sasan
- Debt Reduction: Significant progress in deleveraging
Analyst Outlook & Valuation
| Metric | Value | Sector Average |
|---|---|---|
| P/E Ratio | 8.9 | 27.27 |
| P/B Ratio | 1.82-2.73 | 3.5 |
| Market Cap Rank | 16th in Power Sector | – |
Price Targets: Support at ₹63.66, Resistance at ₹67.99. Mid-term target range ₹76-81 if momentum continues.
Historical vs Current Performance
| Parameter | Current (2025) | Historical (2019-2024) |
|---|---|---|
| Net Profit | ₹44.68 Cr (Q1) | Frequent losses |
| EPS | ₹0.10 | Often below -₹1 |
| Sales Growth | -5.35% YoY | ~0% 5yr CAGR |
| ROE (3yr avg) | Improving | -9.59% |
Investment Considerations
Strengths
- Strong operational turnaround with profitable quarter
- Major project wins in renewable energy sector
- Significant debt reduction progress
- Attractive valuation compared to sector peers
Risks
- Flat sales growth over 5 years (~0.05%)
- History of financial volatility
- July typically negative month for stock
- High beta stock – prone to sharp swings