Comprehensive Analysis of Newgen Software Technologies Ltd. Shares
Key Takeaway: Newgen Software Technologies Ltd. shares have shown strong long-term performance but with considerable short-term fluctuations. As of early August 2025, shares trade near ₹915 with valuation metrics above sector averages, indicating both growth opportunities and investment risks.
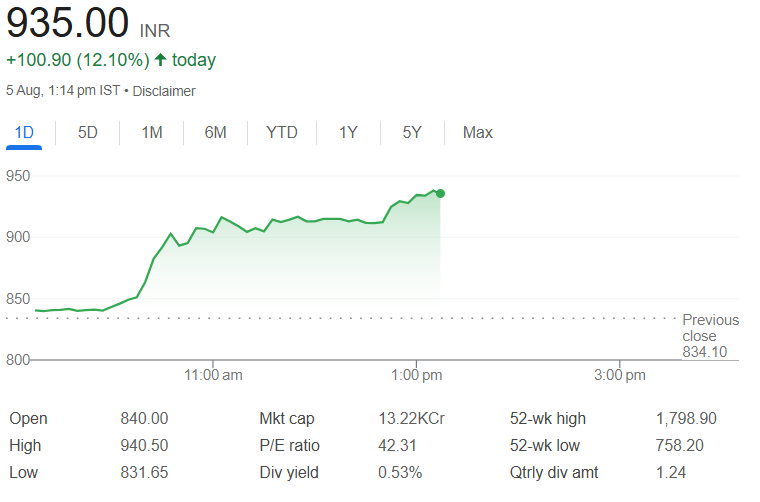
1. Current Market Overview
| Metric | Value |
|---|---|
| Latest NSE Price | ₹915.20 (Intra-day) |
| Previous Close | ₹834.10 |
| Day’s Range | ₹900.00 – ₹918.50 |
| 52-Week Range | ₹758.20 – ₹1,798.90 |
| Market Capitalization | ₹11,810 crore |
| Volume (Latest Trading Day) | ~350,000 shares |
2. Price Performance
| Period | Price Change |
|---|---|
| 1 Month | –27.92% |
| 3 Months | –17.07% |
| 6 Months | –23.12% |
| 1 Year | –12.72% |
| 3 Years | +351.29% |
| 5 Years | +844.09% |
After reaching near ₹1,799 in the past year, shares have declined more than 50%, yet maintain substantial gains over multiple years.
3. Valuation Metrics
| Metric | Newgen | Sector Average |
|---|---|---|
| P/E Ratio | ~37 times | 25–26 times |
| P/B Ratio | 7.8 times | N/A |
| Dividend Yield | 0.60% | 2.73% |
| PEG Ratio | 1.15 (times earnings growth) | N/A |
4. Technical Indicators
- 50-Day Moving Average: ₹1,094.70
- 200-Day Moving Average: ₹1,166.26
- Relative Volatility: ~4.4× Nifty average
The current price sits below both 50- and 200-day averages, suggesting a bearish technical trend.
5. Financial Health
- Revenue Growth (TTM): +18% year-on-year
- EBITDA Margin: ~22%
- Return on Equity (ROE): ~24%
- Debt/Equity: 0.12 times
- Free Cash Flow Yield: ~2.1%
The company maintains strong profit margins and low debt levels, supporting a stable financial position and consistent profitability.
6. Dividend Information
- Latest Dividend: ₹2.50 per share (FY 2024–25)
- Payout Ratio: ~10% of PAT
- Yield: 0.60%
7. Analyst Recommendations
| Recommendation | Proportion of Coverage |
|---|---|
| Buy/Accumulate | 65% |
| Hold | 25% |
| Sell/Reduce | 10% |
8. Investment Considerations
Potential Strengths
- Strong multi-year growth track record
- Healthy profit margins and return metrics
- Low debt burden
- Positioned in growing technology segments
Key Risks
- Higher valuation compared to sector peers
- Sensitivity to changes in corporate IT spending
- Competitive pressures from larger global companies
- Recent significant price decline from peak levels
9. How to Track Share Data
For detailed historical prices and financial information:
- Market Data: NSE/BSE websites, Moneycontrol, Investing.com
- Financial Statements: Company filings on stock exchange websites
- Analyst Reports: Brokerage research available through financial platforms
Final Assessment: Newgen Software Technologies shares present an interesting case of strong long-term performance coupled with recent price declines. While the company shows solid financial metrics and growth potential, current valuations remain elevated compared to the sector. Investors should carefully consider both the company’s strengths and market risks when evaluating investment decisions.