
For those new to the stock market or considering adding Hewlett Packard Enterprise (HPE) shares to their portfolio, understanding the company’s stock potential, financial health, and market position is crucial. This article offers an expert analysis of HPE shares with an emphasis on the Hpe share price target 2030 and beyond, supported by the most recent financial data and forecasts available as of September 2025.
Hpe Share Overview
Hewlett Packard Enterprise Co (HPE), traded on the NYSE under the ticker HPE, is a global leader in IT infrastructure, cloud solutions, networking, and edge computing services. The company has been making strategic acquisitions such as Juniper Networks and focusing on innovation around AI-optimized servers, networking, and hybrid cloud infrastructure, positioning itself as a key player in the evolving tech ecosystem.
- Current Share Price: Approximately $24.73 (as of September 2025)
- Market Cap: Around $27-30 billion USD
- Primary Segments: Servers, Networking, Storage, and Cloud services
- Recent Market Movement: Mixed sentiment with bullish undertones driven by strong Q3 FY2025 results
Fundamental Analysis of Hpe Share
Investors should consider core financial metrics to evaluate the stock’s intrinsic value and growth prospects.
Financial Highlights (Latest Q3 FY2025)
| Metric | Value | YoY Change | Notes |
| Revenue | $9.1 billion | +19% nominal, +18% constant currency | Driven largely by Server and Networking growth |
| Adjusted Earnings Per Share (EPS) | $0.44 | +22% | Beats market expectations |
| Free Cash Flow | $790 million | Strong cash flow generation | Enables reinvestment and shareholder returns |
| Operating Margins | ~6% | Stable to slightly rising | Despite rising costs |
| Net Profit Volatility | Mixed in short term | Recovering strongly after fluctuations | Reflects integration costs |
Profit Growth
HPE’s profitability has improved notably in recent quarters, with adjusted EPS growing 22% YoY in Q3 FY2025 due to effective cost management and higher demand for AI and 5G-related infrastructure.
Sales Growth
Sales surged by 19% YoY in the last quarter, boosted by key products in servers and networking, especially with the strategic Juniper Networks acquisition contributing.
ROE Percentage
Return on Equity (ROE) has shown recovery and upward momentum:
- Approximately 8-9% reported in early 2024
- Trending upwards due to margin improvements and operational efficiency
ROCE Percentage
Return on Capital Employed (ROCE) was about 2.65% as of Q1 FY2025 but the annualized ROCE for fiscal 2024 reached approximately 6.19%, reflecting moderate capital efficiency with potential for future improvement.
Total Expenditure Amount
HPE’s expenditure includes R&D, integration costs of acquisitions, and operational expenses, with cost control helping maintain margins despite inflationary pressures.
Net Cash Flow Amount
- Operating cash flow has increased year-over-year with strong free cash flow (~$2.3 billion in FY2024)
- Cash flow supports dividends and share buybacks, enhancing shareholder value
Total Assets Amount
| Metric | Fiscal Year 2024 (USD) |
| Total Assets | $71.26 billion |
| Current Liabilities | $25.97 billion |
Robust asset base supports product innovation and acquisitions.
Last Few Years’ Performance of Hpe Share
| Year | Revenue (Billion USD) | Net Profit (Billion USD) | EPS (USD) | Share Price Range (USD) |
| 2021 | ~29 | ~2.0 | ~0.38 | 15 – 25 |
| 2022 | ~29.75 | ~2.1 | ~0.40 | 22 – 29 |
| 2023 | ~30.5 | ~2.3 | ~0.43 | 23 – 28 |
| 2024 | 30.13 | 2.55 | 0.44 | 20 – 27 |
| 2025* | 27.94 (Trailing TTM) | ~2.58 | 0.44 | 22 – 26 (Sept 2025) |
*Trailing twelve months (TTM) as of September 2025. Shows steady growth in profitability and stable revenue.
HPE Share Price Target Projections
An array of expert forecasts presents a mixed long-term outlook, reflecting market uncertainty amid technological shifts and competitive pressures.
| Year | Low Target (USD) | Average Target (USD) | High Target (USD) | % Change from 2025 Price* |
| 2025 | 22.00 | 25.43 | 30.00 | +2.7% to +21.2% |
| 2026 | 19.00 | 25.43 | 30.00 | -23.2% to +21.2% |
| 2027 | Not widely forecasted | ~26-28 | – | – |
| 2028 | – | – | – | – |
| 2029 | – | – | – | – |
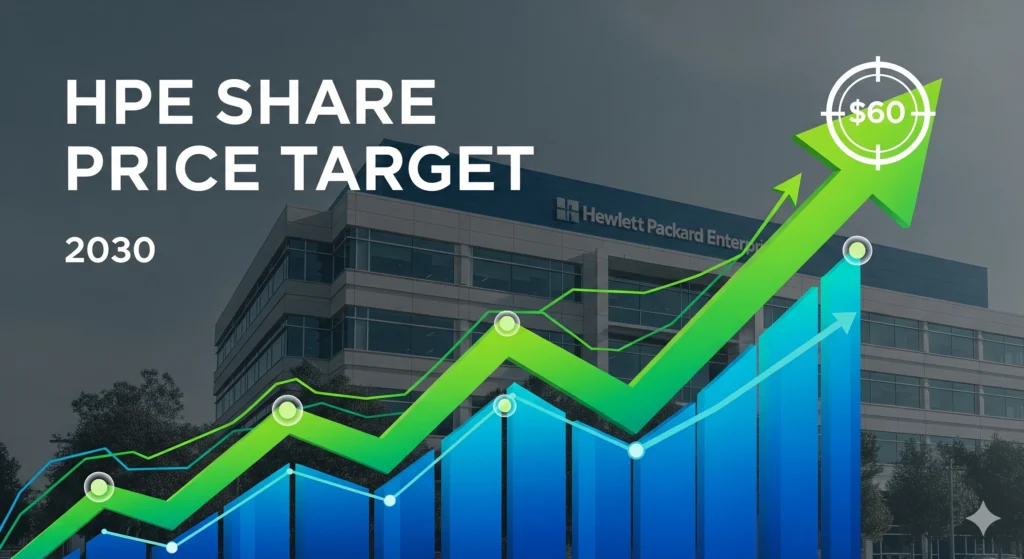
| 2030 | 10.72 | 15.79 | 20.86 | -36.2% to -15.9% |
| 2040 | 19.22 | 21.66 | 25.75 | -12.5% to +4.0% |
| 2050 | 23.83 | 25.75 | 30.00 | +3.7% to +21.2% |
*2025 share price baseline: approx. $24.73
Hewlett Packard Enterprise (HPE) Live Share Price
NYSE: HPE – Real-time stock chart and latest updates
Notable: Price targets for 2030 indicate a possible decline vs current prices, with average forecasts clustering around $15.79, signaling investors should be cautious about expecting large upside in long-term price appreciation without continued strong operational performance and market expansion.
Is Hpe Share Good to Buy?
Considerations for New Investors
- Strong recent revenue and profitability growth, especially in AI, cloud, and 5G networking sectors.
- Valuation metrics: Current P/E ratios suggest the stock is trading modestly compared to peers.
- Stable free cash flow, dividends, and share repurchases offer good shareholder returns.
- Long-term price targets are conservative, signaling expectations of modest growth or volatility.
Risks:
- Tech sector competition is fierce with peers like Dell, Microsoft, CrowdStrike, and NetApp.
- Net profit volatility due to integration costs and supply chain challenges.
- Price target forecasts suggest limited upside toward 2030 under current scenarios.
Factors Influencing Hpe Share Price
- Technology Trends: Adoption of AI, edge computing, and 5G infrastructure directly impact growth.
- Acquisitions: Successful integration of Juniper Networks offers potential synergies.
- Global Economic Conditions: Inflation, interest rates, and supply chain stability affect margins.
- Competitive Landscape: Innovations by competitors can pressure HPE’s market share.
- Investor Sentiment: Market sentiment fluctuates based on quarterly earnings and tech sector trends.
Key Competitors of Hpe Share
| Competitor | Market Focus | Recent Stock Performance (YoY %) | Valuation Indicator (P/E) |
| Dell Technologies | IT infrastructure & services | Moderate steady | ~10 |
| Microsoft Corp | Cloud computing, AI, software | Strong growth | 33+ |
| NetApp Inc | Storage and data management | Mixed response | 12-15 |
| CrowdStrike | Cybersecurity | High growth | 50+ |
| HP Inc. | PCs and printers | Stable | 15 |
These competitors vary in focus from hardware to software and cloud services, each putting unique pressures on HPE’s positioning.
Expert Forecasts on the Future of Hpe
Bull Case
- Continued growth in AI, cloud, edge computing drives robust demand.
- Effective synergy realization from Juniper Networks acquisition.
- Strong free cash flow supports shareholder returns and R&D.
- Increasing digital transformation spend by enterprises globally.
- Innovation in hybrid cloud and SaaS offerings.
Bear Case
- Intensifying competition compresses margins.
- Failure to fully integrate acquisitions leads to costs and operational distraction.
- Economic slowdowns reduce IT budgets.
- Stock price declines reflecting market pessimism on long-term growth.
- Market moves to more software-centric or cloud-native competitors.
Conclusion
Hewlett Packard Enterprise (HPE) shows strong financial fundamentals and promising short- to mid-term growth potential fueled by innovation, strategic acquisitions, and solid execution. However, long-term share price targets for 2030 and beyond suggest price appreciation may be moderate or even down from current levels without major breakthroughs or market shifts. For new investors, HPE stock can serve as a balanced play in IT infrastructure and hybrid cloud sectors with ongoing dividends and cash flow benefits but should be approached with realistic expectations about growth and market volatility.
FAQs
Q1: What is the Hpe share price target for 2030?
A1: Analysts expect an average price around $15.79 by 2030, with a high forecast near $20.86 and a low forecast around $10.72, indicating modest to negative growth compared to current prices.
Q2: Has HPE shown profit growth recently?
A2: Yes, HPE’s adjusted EPS grew by 22% year-over-year in the latest quarter, supported by revenue growth in servers and networking.
Q3: Is HPE a good long-term investment?
A3: HPE offers stable cash flow and dividend returns with growth potential in key tech areas; however, the long-term price targets are conservative, suggesting measured growth with risks from competition.
Q4: Who are the main competitors of HPE?
A4: Key competitors include Dell Technologies, Microsoft, NetApp, CrowdStrike, and HP Inc., each with distinct market niches influencing HPE’s competitive landscape.
Q5: What factors influence HPE’s share price?
A5: Market demand for AI, cloud, and networking solutions, successful integration of acquisitions, global economic conditions, and competitive pressures are major influences on HPE’s stock price.